
A Record That Means Less Than It Sounds
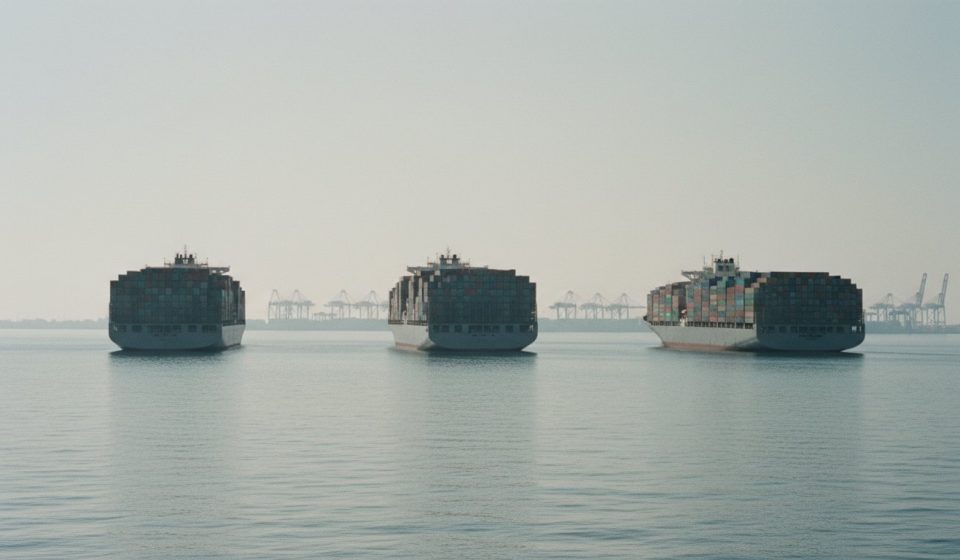
In the week of 25 August, the analytics firm Linerlytica counted 4.31 million TEU of containership capacity waiting to berth at ports worldwide. That beat the previous peak of 4 million TEU, set in 2022 when post-pandemic volumes overwhelmed terminals.
Headline records invite headline panic. This one deserves a second number beside it. That stranded capacity is 12.6% of the world fleet today. In 2022 the smaller figure represented 15.7%.
The fleet grew. Shipping lines ordered heavily through the boom, and those ships are arriving now. So a bigger absolute queue is being held by a proportionally smaller share of global capacity — which is exactly why freight has not repeated 2022’s collapse in service, and also why the current market is more fragile than it looks.
Where the Ships Are Sitting
The queue is overwhelmingly Asian. More than 1.5 million TEU has been at anchor off Shanghai alone, with large volumes also waiting at Singapore, Busan, Colombo and other Chinese ports. Mumbai has had the highest queue-to-berth ratio of any major port.
Weather did much of the damage. Typhoon closures shut Shanghai and Ningbo for several days in late August, and the backlog rolled south through the network. By 8 September the seven-day average wait at Shanghai was 4.72 days, with individual terminals worse — over nine days at Waigaoqiao and over seven at Yangshan. Ningbo averaged 3.58 days.
The knock-on effect is in reliability rather than raw waiting time. Sea-Intelligence data puts roughly two-thirds of container vessels on schedule, with average delays of more than five days. A five-day average delay is what turns a planned inventory buffer into a stockout.
The Rankings Redrawn by a War
The first half of 2026 rewrote the league table, and not because of gradual commercial shifts.
Ningbo-Zhoushan passed Singapore to become the world’s second-busiest container port, handling 22.90 million TEU against Singapore’s 22.74 million — a margin of just 158,310 TEU, or well under a week of throughput. Ningbo grew 8.8% year on year; Singapore grew 4.7%.
The violent move was in the Gulf. Dubai’s Jebel Ali fell from 10th to 32nd in the global rankings as disruption around the Strait of Hormuz pushed carriers to redesign networks around it. Its throughput dropped from 7.77 million TEU in the first half of 2025 to 3.14 million in the first half of 2026 — a fall of about 60% year on year.
We wrote last week about how differently Washington and commercial trackers count traffic through Hormuz. Jebel Ali’s numbers are the commercial answer to that question. A port does not lose 4.6 million TEU because of a counting dispute.
Why Congestion Is Propping Up the Market
Here is the part that matters if you buy freight rather than move it.
Ships stuck in queues are ships not carrying cargo. Congestion absorbs capacity, and absorbed capacity behaves exactly like scrapped capacity in a rate model: it tightens supply. Rates have risen sharply — reported at 156% above pre-war levels since the Iran conflict began — and the idle fleet has nearly vanished, at 55 ships and 164,000 TEU, about 0.5% of a roughly 5,400-vessel fleet.
Linerlytica expects the backlog to keep ships fully employed even through Golden Week, the Chinese holiday beginning 1 October when factories normally slow, volumes fall and carriers cancel sailings. A market that stays tight through Golden Week is a market where congestion, not demand, is setting the price.
Which sets up the risk. The same shipyard deliveries that make the 12.6% figure look manageable are still arriving. If the queues clear — better weather, a Hormuz de-escalation, Chinese terminals catching up — that capacity returns to service all at once, into a fleet that has grown. The correction would be fast.
What to Watch
- Blank sailings around Golden Week. If carriers cancel few or none, congestion is doing the work that demand usually does, and rates are borrowed rather than earned.
- Shanghai and Ningbo waiting times. They peaked in the typhoon window and were easing by early September. A sustained drop below two days is the signal that stranded capacity is coming back.
- Whether Jebel Ali recovers, or the cargo stays moved. Networks redesigned around a port tend to stay redesigned. Watch transhipment gains at Salalah, Jeddah and the Indian ports.
If you are contracting ocean freight for the first quarter of 2027, price the queue, not the record. The absolute number is the biggest ever recorded; the proportion is not, and the proportion is what sets rates. Lock in duration only where the route depends on ports that would take months to recover — and keep the shortest contracts on the lanes that clear fastest.
Get the weekly briefing
One email a week on AI, infrastructure, policy and the supply chains underneath them. Free, and you can unsubscribe any time.